The Inverted Head and Shoulders Pattern is a powerful and reliable bullish reversal chart pattern that often signals a reversal from a downtrend to an uptrend. Below is everything you should know about this pattern to use it effectively in trading.
The Inverted Head and Shoulders pattern is the opposite of a regular Head and Shoulders pattern. It consists of three main troughs (low points) on a price chart:
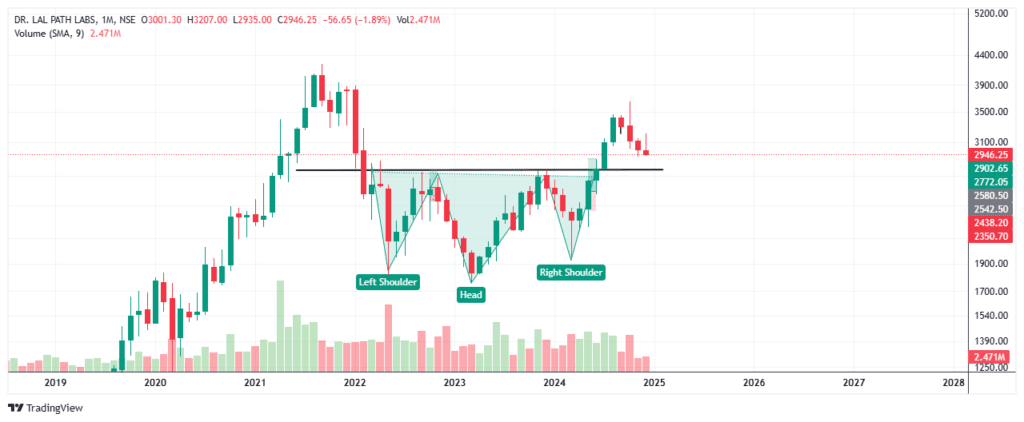
- Left Shoulder (First Trough): A smaller decline in price, followed by a recovery.
- Head (Second Trough): The deepest decline, forming the lowest point of the pattern.
- Right Shoulder (Third Trough): A smaller decline (similar to the left shoulder) that indicates buyers stepping in earlier than before.
- Neckline: The resistance level that connects the peaks formed between the left shoulder, head, and right shoulder.
Key Features of the Inverted Head and Shoulders
- Trend Context:
- The pattern occurs in a downtrend and signals a potential reversal to an uptrend.
- Symmetry:
- The left and right shoulders are often symmetrical in terms of height and duration, though they don’t have to be perfectly aligned.
- Volume:
- Volume tends to decrease during the formation of the pattern (especially in the shoulders).
- A volume spike during the breakout above the neckline adds confirmation.
- Breakout:
- A bullish breakout is confirmed when the price closes above the neckline.
- Duration:
- This pattern typically takes longer to form than smaller reversal patterns (e.g., double bottom), as it often reflects significant market accumulation.
Steps to Identify and Trade the Pattern
Step 1: Identify the Pattern
- Look for the left shoulder, head, and right shoulder forming in a downtrend.
- Ensure the neckline connects the peaks between the troughs.
Step 2: Wait for a Breakout
- The breakout happens when the price closes above the neckline.
- Higher volume on the breakout strengthens the signal.
Step 3: Enter the Trade
- Enter a long position after the price breaks and closes above the neckline.
Step 4: Place Stop Loss
- Set the stop loss slightly below the right shoulder or the lowest point of the head for protection against false breakouts.
Step 5: Set the Target
- Measure the height of the pattern (distance from the neckline to the lowest point of the head).
- Add this height to the breakout level (neckline) to set your target price.
Target and Stop Loss
Target Calculation:
- Height of the Pattern: Measure the distance from the lowest point of the head to the neckline.
- Add this distance to the neckline breakout point to calculate the target price.
Example:
- Lowest point of the head = ₹50
- Neckline breakout level = ₹60
- Height of the pattern = ₹60 – ₹50 = ₹10
- Target price = ₹60 + ₹10 = ₹70
Stop Loss:
- Place the stop loss just below the right shoulder or below the head, depending on your risk tolerance.
Volume Characteristics
- During Formation:
- Volume decreases during the left shoulder, head, and right shoulder, indicating weakening selling pressure.
- During Breakout:
- A breakout above the neckline should be accompanied by a spike in volume, confirming buyer strength.
Importance of the Neckline
- The neckline acts as a resistance level during the pattern formation.
- When the price breaks above the neckline, it flips into a support level, providing additional confirmation of the bullish trend.
Bullish Signal Confirmation
- To confirm a bullish reversal:
- Wait for a strong close above the neckline.
- Higher volume during the breakout strengthens the signal.
- A successful retest of the neckline as support (if it occurs) can further validate the trade.
The classical Inverted head and should is visible in the Dr Lalpath labs on monthly time frame .
Note: This blog is just for education purposes , there is no buy or sell recommendation. Trade/invest at your own risk .


