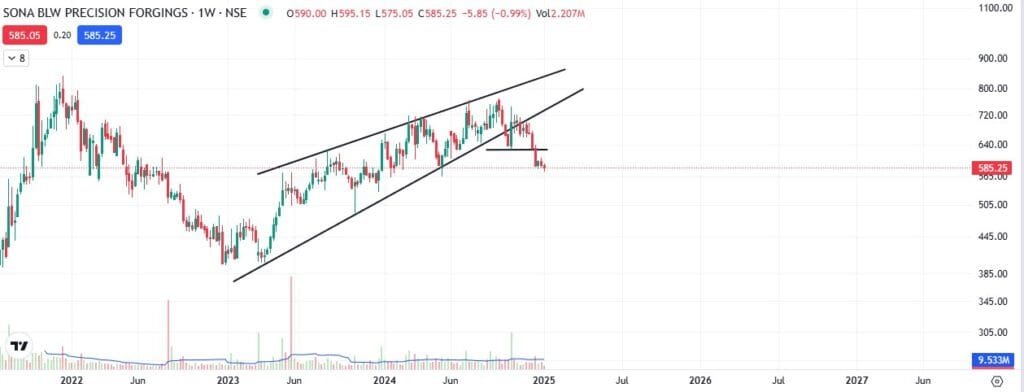
The Rising Wedge Pattern is a bearish chart pattern commonly observed in technical analysis. It occurs when the price of an asset is consolidating between two upward-sloping trendlines that are converging. This means that while the price is rising, the rate of increase is slowing down, indicating weakening momentum. The rising wedge pattern typically signals a potential reversal to the downside, especially in a bearish scenario, although it can sometimes occur as a continuation pattern in an uptrend.
Characteristics of a Rising Wedge Pattern:
- Converging Trendlines:
- The pattern is formed by two trendlines: the upper trendline (resistance) and the lower trendline (support), both sloping upwards.
- The upper trendline has a shallower slope than the lower one, causing the lines to converge over time.
- Volume Decline:
- During the formation of the wedge, trading volume usually declines, indicating a lack of strong buying interest.
- Bearish Reversal:
- The pattern is often seen as a precursor to a downward price movement (reversal).
- Breakout Direction:
- Price typically breaks down below the lower support line.
- The breakdown is usually accompanied by an increase in volume, confirming the bearish move.
- Duration:
- Rising wedge patterns can occur over different timeframes (short-term, medium-term, or long-term).
How to Identify a Rising Wedge Pattern:
- Look for a chart where price action is trending higher, but the highs and lows are forming within converging upward-sloping trendlines.
- Ensure that the slope of the lower trendline (support) is steeper than the upper trendline (resistance).
- Observe decreasing trading volume as the pattern develops.
How to Trade a Rising Wedge Pattern:
- Confirmation:
- Wait for the price to break below the lower support line. This confirms the breakdown.
- Look for an increase in volume during the breakout for added confirmation.
- Entry Point:
- Enter a short (sell) position when the price closes below the support trendline.
- Stop-Loss Placement:
- Place a stop-loss just above the upper resistance trendline or the recent swing high.
- Profit Target:
- Measure the height of the widest part of the wedge and project it downward from the breakout point to estimate the target price.
Make sure, one uses a strict stop loss because these pattern many times fail also . Stop loss will save from the major losses if one working on a leverages position .
Note: This blog is just for education purposes , there is no buy or sell recommendation. Trade/invest at your own risk .


